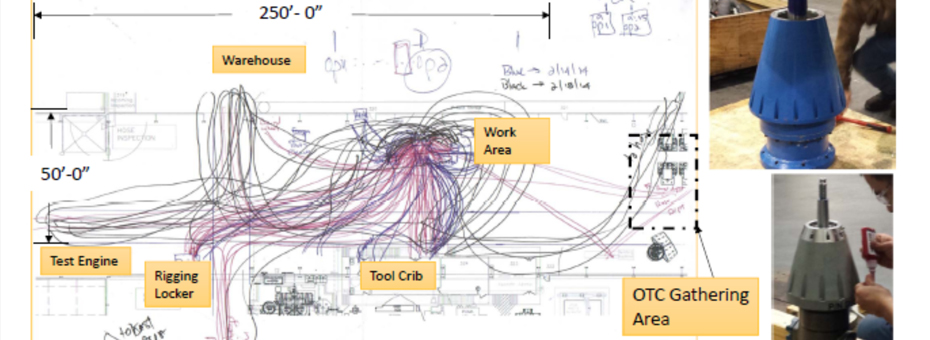
Sometimes the simplest lean practices can reveal the most complicated problems. Take, for example, the humble spaghetti chart, used to plot “…the path taken by a product as it travels through the steps along a value stream,” according to The Lean Lexicon. A visit to the gemba, a simple drawing, and you’ve got your spaghetti chart. Nothing too fancy – yet what it can reveal can be staggering.
A great example of a company that had such an experience is Thrustmaster of Texas, a Houston-based manufacturer of marine propulsion equipment. As part of a lean transformation to combat high costs and low on-time deliveries, the Thrustmaster lean team – led by CI Manager Frank Montemayor and GM Jason Small – created a spaghetti chart of the assembly department where they build, test and package tunnel thrusters.
None of them were prepared for what they uncovered, as you can probably imagine from looking at the chart above. Their calculations showed that getting a tunnel thruster assembled and ready to ship required an incredibly high number of steps. With technicians alone needing to take 110 steps each, the amount of walking (read: non value-added work) done by the workers added up to over seven miles. Translated into minutes, that meant nearly 10 hours were being wasted per unit of product.
With these results under their belts, the Thrustmaster team overhauled the layout of the Assembly area, while focusing on flow, elimination of waste and standard work, among other improvements. The results spoke for themselves – just 18 months later, Thrustmaster had achieved 100% on-time delivery and significant cost reductions. Thanks in no small part to a deceptively basic lean practice that anyone can use.
What basic lean practices do you use to reveal big problems?


