Despite the dramatic improvements that lean thinking creates on the shop floor, many companies fail to see corresponding impacts on their financial statements. Recently, a division of Parker Hannifin has bridged this frustrating disconnect between shop-floor improvements and the financial statement by implementing a lean accounting system that includes replacing the standard costing system with value-stream costing.
“There are two purposes served by a cost system,” said Fred Garbinski, Parker Hannifin’s director of corporate accounting. “The first is to value inventory. For that, standard costing systems do a nice job. The second purpose is to manage and control operations. For that, standard costing misses the mark.”
How badly it misses becomes apparent as companies implement lean principles. From a lean perspective, standard cost systems encourage people to do the wrong things. Some of a standard cost system’s “air balls” include:
- inducing companies to build in large batches in order to keep machines running and people busy to absorb overhead
- not providing daily performance information needed to support continuous improvement at the cell and value-stream levels
- requiring huge amounts of computer resources and nonvalue-creating activities to gather and process work-order transactions
- failing to capture the vast benefits that lean generates in the form of higher quality, shorter lead times, and especially the added capacity gained from people, equipment, and space
The reason for the disconnect between lean and standard costing is that standard costing was developed as part of traditional accounting systems to support mass production. Such systems assume companies make money by keeping machines and people running in overdrive, creating mountains of widgets in order to lower unit costs. Financial control is exerted by checking the “mountain” frequently and recording the results as it is pushed at a glacial pace from process to process. This leads to a complex and time-consuming accounting system that chug-a-lugs thousands of transactions monthly and spits out reams of reports comparing the mountain’s actual results against a standard in such areas as labor and machine utilization. Unfortunately, the reports are useless for managers trying to run and improve the business.
Prerequisite for Lean Accounting
As a lean transformation of the shop brings processes under control and increases the velocity of material and information, the need for the transactions, complexity, and lengthy reports goes away. Batch production gives way to making today what the customer wants today. The mountain of widgets becomes a foothill or even an anthill. And as it moves rapidly through streamlined processes, tracking and valuing inventory becomes much simpler — or unnecessary — because material is moving faster than the time needed to collect inventory tracking data at each process. The focus becomes optimizing the value stream for a product family, not optimizing individual operations.
Although the need for the old standard cost system fades away, the system doesn’t. It remains stubbornly rooted in place until supplanted by an accounting system specifically designed to support value-stream performance assessment and planning. At Parker, the step-by-step process of supplanting traditional accounting with something much leaner looked like this:
- develop cell performance measures
- develop value-stream performance measures
- develop a value-stream profit-and-loss (P& L) statement
- calculate improvements in capacity and turn this into valuable decision-making data
- develop a value-stream box score that integrates operational, capacity, and financial data
- turn off the standard cost system
The prerequisite to implementing a lean accounting system is having a lean value stream. At the Parker division, which employs more than 500 people, the lean transformation began in 2000 by removing waste from the value streams for making hydraulic components, its main product.
At that time, there were parts all over the shop and equipment was widely dispersed in a process village lay out. To make components on the high-volume line, one of five product family value streams in the shop, seven steps were required from rough machining through finished machining and packing. Parts were stacked on carts and pushed to the next process where they waited in queue. The machining setups took several hours, so batches big enough to last three weeks were run. A part needed five days to snake its way through the line from start to finish. (See the before and after diagrams.) As a result of the large lots and the inflexibility of the system, the division frequently had to expedite orders. At the worst point, it was incurring a small fortune in premium freight costs per month, including several plane charters, air freight, and expedited truck shipments.
Due to the lean effort, the high-volume value stream can now produce to confirmed orders. The line gets a forward forecast from customers and firm orders weekly or daily. Division officials say scheduling is relatively easy now, but, prior to the lean effort, scheduling was a vicious circle of expediting, falling behind, trying to catch up, expediting, falling behind, etc.
Setups have been cut by 60% to 95%, depending on the complexity of the equipment. Throughput time, even for large orders, is now just hours. A typical lot size of about 1,000 pieces takes about a shift to make and ship. A product-line manager noted that people are often packing parts at one end of the value stream while the last parts in the order are emerging from equipment at the beginning of the value stream.
And the company hasn’t used premium freight in three years.
Snapshot of Division Shop-Floor Lean Improvements
|
Jan. 2000 |
May 2003 |
|
|
Return on assets |
+78% |
|
|
Return on sales |
+74% |
|
|
On-time delivery |
85% |
95% |
|
Premium freight expenses |
-99.8% |
|
|
Scrap rate |
-51% |
|
|
Average days of inventory |
-41% (to16 days) |
|
|
Productivity |
+15% |
Source: Parker Hannifin
Cell and Value-Stream Performance Measures
With the lean improvements underway, the plant established daily performance measures and weekly value-stream measures in the five value streams. On the high-volume line, for example, the performance measures are setup times and units produced every two hours as measured against the demand rate for the two-hour period. Performance for both measures is recorded on large white boards near the two cells in the value stream. Every two hours, a supervisor records the cell’s output and initials the board. If production is missed, the supervisor lists the reason and the countermeasures taken, and then initials the board.
Value-stream performance is recorded monthly (weekly is the goal) in five areas:
- customer service, measured as on-time delivery to the customer’s requested delivery date
- productivity, measured as sales dollars per person
- inventory, measured as the number of “days of inventory” in the value stream
- safety, measured as lost-time accidents
- quality, measured as scrap
Results for each measure are graphed on separate sheets of 8½-by-11 inch colored paper. The five sheets are posted in a row inside a glass case hanging on the wall near the value-stream’s end. Below these hang charts showing the three top problems in the areas of customer service, safety, and quality. Below these are lists of ideas for solving the problems.
After the lean implementation and the creation of monthly and daily measures, the standard cost system based on work orders and variance reporting remained in place, even though product line managers used it less and less to run their value streams. “We physically managed the business using the lean measures and reacted immediately when we had problems,” said the product-line manager. “We weren’t using standard rates and efficiencies. We were only using the cost system to value inventory.”
Ultimately, division and company officials realized that breaking with the cost accounting system was needed to move the lean transformation to the next level. “Measurement systems influence behavior,” said the division controller. “If I use a mass production accounting system, am I ever going to get where I want the lean conversion to be?” Discontinuing the system would also remove wasteful transactions that consumed resources but didn’t add value to the product from a customer’s viewpoint.
“If I have this cost system, I have to keep feeding it,” the controller explained. “What do I feed it? Work orders. At a point when the work order transaction processing is only used for valuing inventory for reporting purposes, the system begins to get in the way. It was consuming more time than it was worth because we were producing the product faster than we could actually create the data.” For instance, most customer orders were made and shipped in a day. But it took days to enter data from the completed work orders into the computerized financial system, backflush, and issue reports.
“You have to begin dismantling those kinds of systems,” he said. “Well, when you dismantle the standard cost system you ask, What do I turn to?” The division turned to the kaizen process and its value stream maps.
The Financial Kaizen
With the cell and value-stream performance measures in place, a five-day kaizen workshop was planned to implement the first elements of a lean accounting system. This involved developing the value-stream P & L statement, translating capacity improvements into financial data, and integrating operational, capacity, and financial information to create a new tool that could be used to manage and improve the value streams. The kaizen workshop also set the path for installing advanced elements of a lean accounting system, such as replacing the standard cost system with value-stream costing and target costing.
The high-volume line was chosen as the pilot project for the kaizen workshop. Among the five value streams, it was the farthest along in implementing lean and as a high-volume/low-variety stream, it also offered a relatively clear-cut example for financial analysis.
The kaizen team included about 10 people from operations, finance, marketing, and information systems and was led by consultant Brian Maskell. The Parker division manager, members of his staff, and plant personnel set the foundation for the kaizen by attending two preliminary workshops that covered the principles of a lean accounting system. Then they gathered needed plant data from value-stream maps, the value-stream performance measures, and the general ledger.
Moving away from standard costing to value-stream costing meant collecting and reporting financial data by value stream. The team, therefore, had to create a value-stream P & L statement. To do this, during the kaizen, the team gathered data on costs consumed in the value stream directly related to manpower, equipment, material, outside costs, facility costs, and any other costs — such as supplies, soft tooling, and MRO parts consumed in the value stream. These costs were charged directly to the value stream. For instance, material costs were charged at the time of purchase. The cost of any product made in the value stream became the average costs of all items made in the value stream during a particular period.
The rationale for this approach is that a value stream is a fixed routing for a group of products. As companies dramatically reduce lead times and inventories, they become more like a process manufacturer than a discrete producer because the products flow through a process that is relatively fixed and homogeneous for all products. Instead of worrying about the least cost per unit at each operation, managers focus on the least total cost of units shipped from the value stream. The incentive to run operations at full capacity to build inventory or earn hours for variance reports disappears. (Note: Some value streams have a higher variety of products that require more effort to make than the average. In these streams, the characteristics that add product costs are identified and the average is adjusted to account for the extra effort and resulting costs.)
The kaizen team used monthly figures for the P & L statement that it created in the pilot project. But the statement was designed to be simple and accurate so results could be calculated weekly in less than half-an-hour for each value stream.
The traditional reporting did not vanish completely. The value stream had to cost what little inventory existed in order to prepare monthly financial statements needed at the corporate level. This information is reported using the traditional standard cost format. Division financial staff members make three journal entries to prepare the corporate report. In about two hours at the end of each month, they take a physical inventory and prepare one journal entry to calculate the cost of sales, one for scrap, and one for the change in inventory.
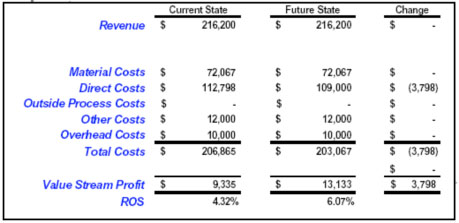
Source: BMA Inc.
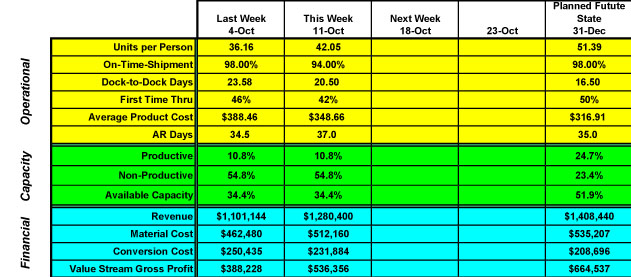
The sample value-stream P & L statement above is used weekly to compare the average direct costs of a value stream in the current and future states.
The value-stream P & L is easy to understand and use by the value-stream team — which is responsible for driving down the average cost per part — as well as by people in finance, marketing, and senior management. But to understand the financial impact of lean on the value stream, another tool is needed.
“Most companies implementing lean thinking do not see short-term bottom-line improvement,” Maskell observed. In fact, financial statements often show profits declining because lean improvements in the shop have removed inventory available to absorb overhead allocations.
“Lean really creates capacity,” said Maskell. “If you don’t deploy the freed capacity, no benefit falls to the bottom line.” Management must decide how to use this capacity as well as the cash flow from reduced inventory.
Supplementing the Value-Stream Maps
No new systems or lengthy reports were needed to create the new tool because most of the required information was available from the value-stream maps. The financial kaizen team retrieved the line’s current-state value-stream map and found information on cycle time, changeover time, the number of operators, and machine uptime in the data boxes under each process box.
The team added scrap rate data to better understand how capacity was being used. It also measured the square footage occupied by the value stream so it could put a financial number on this resource as lean thinking made more space available. Next, the team made the same additions to the future-state map.
The next step was to perform a series of calculations to establish the existing capacity, compare it to the capacity freed by the future-state changes, and put a value on the additional capacity. The Parker team then:
- Referred to the current-state map and listed the process steps in the current-state value stream and the resources used at each — machines, people, space, materials and outside costs. If resources were not used at a particular step, they were not included. For example, step 1 in the diagram of the high-volume line only had two resource types — machines and people.
- Determined the total available capacity for the machines and the employee resources assigned to each process. This is the available employee or machine working time on the current-state map translated into seconds.
- Listed the main activities at each step, such as producing for demand, overproduction ( producing for inventory), changeover, waiting, inspection, moving materials, rework, etc.
- Categorized these activities as productive (producing to fulfill demand), nonproductive (overproduction, changeover, breakdowns, rework ,etc.), management and improvement (meetings, training, improvement activities), or available capacity (what’s left after the other categories have been totaled).
- Figured out how much time is used by each activity at each step. For example, to determine how much time was spent producing components for demand, the team multiplied machine cycle time from the value-stream maps by the number of units ordered per month.
- Converted the time consumed by each activity into a percent of total available time.
- Listed the percentage of each type of capacity (productive, nonproductive, management and improvement) available by each resource type.
- Repeated the analysis for the future-state map. This showed that the lean improvements dramatically reduced the nonproductive capacity and dramatically increased available capacity.
- Calculated the improvements in floor space and inventory for the current and future states.
- Turned the capacity analysis into dollars by multiplying the capacity percentages for each resource by the cost of the resource. (The team then repeated this calculation for the future state.)
With the capacity analysis done, the kaizen team created a “box score” for the value stream that showed at a glance the operational, financial, and capacity measures.
The box scores were posted near the value stream and added to the value-stream maps to give a weekly three-dimensional view of value-stream performance. A value-stream managers, called product-line managers at the plant, and the product line team used the box scores weekly to quickly and accurately monitor the performance of the value streams and the effects of improvement projects.
“It’s a very visual system,” said Garbinski.
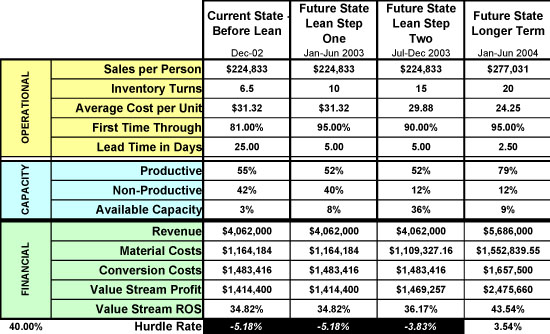
Source: BMA Inc.
This box score from another company shows the long-term effects of a lean transformation. The box score combines operational and capacity information with financial data. The conversion costs are made up of the employee costs and the machine costs. These don’t change if the value stream has the same number of people and the same machines over the period covered by the box score. The conversion costs go up in this example because the company needed to obtain some additional equipment, tooling, soft tooling, and supplies.
Source: BMA Inc
In this example, the flexible box score format is used to summarize a value-stream’s performance for the regular weekly meeting of the value-stream manager and team members.
Once these new lean tools and controls were developed to keep track of the financial and operational parts of the business, the kaizen team eliminated standard cost transactions for four of the plant’s five value streams. Instead of using transactions, inventory is now expensed on receipt and most materials are purchased from certified suppliers based on blanket purchase orders and executed with kanban cards or vendor-managed inventory. Thousands of transactions to track labor and materials have gone away, eliminating paperwork, reports, and meetings. The impact was quickly felt on the shop and in the office.
Under the old cost accounting system, operators filled out cards daily to report how many pieces they ran. Then the cards went to a planner who used them to backflush the system. Each night, the planners and dispatchers cycle counted what had been backflushed to make sure that the production data in the system matched the actual production on the floor. Under the new lean accounting system, a target date was set for eliminating such transactions and filling out the cards, backflushing, and cycle counting stopped.
A few days after the cost accounting transactions stopped, division officials reported that there had been “no major glitches” in cutting the umbilical to the old system. Planners, who used to spend hours doing the backflushing and processing work orders, were going to become more involved in continuous improvement activities, such as the monthly kaizen events. The division runs three or four kaizens per month, often one per value stream. The events always occur during the second week of the month. This way, a finance manager explained, the whole organization knows it is kaizen week, which minimizes the disruption. Support functions can plan to standby to help with designing a new gauge, making a tool, moving machines, etc.
Better Data for Growth
During the financial kaizen, the team also pioneered using the new value-stream cost data for decision making. In an exercise, team members reviewed past standard cost analyses of new products that had been rejected for having low margins. Value-stream cost analysis showed that many of products were actually very profitable. A division sales and marketing manager noted the products will be reconsidered as a result
The kaizen set a timetable for switching to value-stream costing in making decisions on new product profitability, pricing, and capital equipment purchases. The kaizen also set a timetable and path for using target costing to gain a better understanding of value from the customer’s viewpoint and translating that into product costs that meet customer expectations.
The new decision-making and target-costing approaches will “minimize the distractions” from investigating what turns out to be low gross-margin work, Garbinski noted. “It will save us work. It will give us the information we want to grow the business.” Another advantage is that the new system helps to remove obstacles. The old accounting system diverted finance to explaining variances instead of focusing on improvement and removing obstacles. ,” he noted
Garbinski and other executives at Parker believe a lean accounting system must ultimately play a pervasive role in a company trying to grow the business and advance the lean transformation while maintaining control. “It simplifies what we do, it’s a better match with what we’re doing on the shop floor, it’s more accurate, and it’s consistent with the behavior you want,” he said. “The bottom line for this Parker division is that lean accounting gives it better information with a lot less work. It now has cost information everyone can understand, and that leads to better business decisions. The new measurements actively move the lean vision forward, and target costing keeps them squarely focused on customer value. This is a quiet revolution that is springing up all across Parker right now.”
For more information
With annual sales of $6 billion, Parker Hannifin Corporation is the world’s leading diversified manufacturer of motion and control technologies, providing systematic, precision-engineered solutions for a wide variety of commercial, mobile, industrial and aerospace markets.
Workshops and Workbooks
The Lean Enterprise Institute (LEI) runs monthly regional workshops on basic and more advanced lean tools. You can read complete descriptions of workshop content with the latest dates and locations at LEI Training. LEI workbooks and training materials – all designed to de-mystify what a sensei does – show you what steps to take on Monday morning to implement lean concepts. Visit the LEI product catalog to see the resources available for supporting lean transformations.
Glossary
The development and production cost that a product cannot exceed if the customer is to be satisfied with the value of the product while the manufacturer obtains an acceptable return on its investment. Toyota developed target costing for its small supplier group with which it has had long-term relations. Because there is no market price available from taking bids or conducting an auction, Toyota and its suppliers determine a correct/fair cost (and price) for a supplied item by estimating what the customer thinks the item is worth and then working backwards to take out cost (waste) to meet the price while preserving Toyota and supplier profit margins.
All of the actions, both value-creating and nonvalue-creating, required to bring a product from concept to launch and from order to delivery. These include actions to process information from the customer and actions to transform the product on its way to the customer.
