I remember a project where I helped facilitate problem-solving teams at a small manufacturing company. One group was developing scheduling software to help them schedule the production of samples. The problem was that they commonly had requests for product samples, which often caused problems when they added a sample order to the production process. As a result, the team had trouble meeting the sample required date and being on time in their regular production schedule, so they decided they needed to change their production scheduling software.
By now, you have probably already concluded that new software was not a problem but rather a solution. But, as a lean practitioner, you likely know that people often present their solution as the problem. So, for example, “the problem is that our current software doesn’t allow us to properly schedule small sample runs.”
I found the team in a conference room brainstorming ideas about how to schedule samples better. I asked them why their production process could not accommodate the interruption of a sample order. No answer. Then, I asked what the production process’s steps were and where the sample order caused a problem in that process. After some discussion, it was clear that there were many differences in opinion.
Finally, I asked them why they were in a conference room arguing. I suggested we all go to the line and try to understand what was happening when they added a sample order to the schedule.
Go to the Gemba
As we walked the line, I had my notebook and pencil out. We walked each step and noted the work-in-process inventory (WIP). I timed and recorded the cycle time of each process step. We asked the workers how long the changeover from one product to another took. And we asked the workers about the problems they experienced when they needed to complete a sample order.
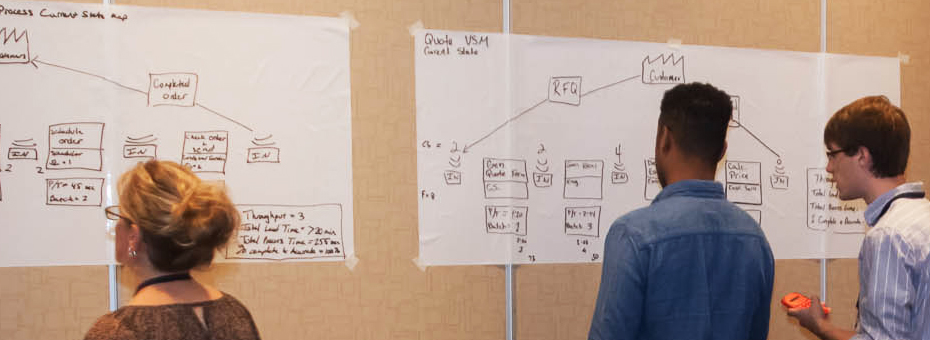
Getting a baseline understanding of the process took us about 20 minutes. When we finished, we had an old fashion process and material flow chart (today, more commonly called a value-stream map). But, most importantly, our discussion with the workers had pointed us to one process step that typically got behind when adding sample orders into the process.
Together as a team, we referenced the map to come to a shared understanding of how the process worked. Doing the math with the cycle times and changeover times we had on our map, it was easy to see how a sample order that required extra time at one step of the process tended to starve the rest of the production line, causing regular production to fall behind.
Again, standing near the production line, we did the mathematical calculations and discovered that adding WIP at one process to buffer the interruption caused by the sample order could keep the line running and on schedule. So the team decided to increase the WIP accordingly and experimented with some sample orders that afternoon to see if it worked.
… the purpose of a value-stream map is to create a shared understanding of a process.
As we were walking away from the line, one of the team members told me, “It usually take us two days just to do a value-stream map, but you just did one in 20 minutes.” I explained that the purpose of a value-stream map is to create a shared understanding of a process. My observation of the team’s discussion told me they didn’t have this common understanding and were arguing based on opinions. Therefore, we needed to go and see and then draw what we saw so everyone would understand the problem similarly.
By the way, with a couple of check-and-adjust cycles, they got the WIP inventory at the right level so that samples no longer caused a problem at a total cost of $0. Moreover, the map-drawing process also revealed some underutilized equipment, which they used to achieve additional capacity — again, at no added cost. These results demonstrate how value-stream mapping can free up overlooked growth capacity, which is the real impact of lean thinking and practice.
Get Back to Basics
So, how are you creating value stream maps? Are you spending days using fancy software to draw pretty maps suitable for lamination? Are you worried about whether you have used the correct symbols and recorded all the right information? Or are you drawing simple representations of how the processes link to create value? Are you drawing value-stream maps as a team to create the common understanding that leads to an agreement to implement a countermeasure as an experiment? And, are you doing mapping at the gemba by observation and discussing with the people who do the work?
I encourage you to use the powerful value-stream mapping process in its most basic form. Use a pencil and paper and work with your teams to collect as much information as you need to see and better understand your process steps and how material and information flow through those processes. So gather your team, get your pencil and pad, and go see to understand together.
Editor’s Note: This Lean Post is an updated version of an article published on October 22, 2014, one of the most popular posts about this vital lean practice.
Learning to See Using
Value-Stream Mapping
Develop a blueprint of improvements that will achieve your organization’s strategic objectives.


I had to make a value stream map as a part of my yellow belt project and we ran into similar problems that you addressed. One of our problems was we first tried to do our map on a fancy software that we were unfamiliar with, this added more complexity than needed. I then closed the computer and took out a pencil and paper. From there we were able to map out our process much better and then we transferred it over to the software after it was completed. I also like how mentioned that instead of arguing over what the problem might be, value stream maps help you understand what the actual problem is. From this article I learned that people often present their solution as the problem and that you should instead explore other options first.