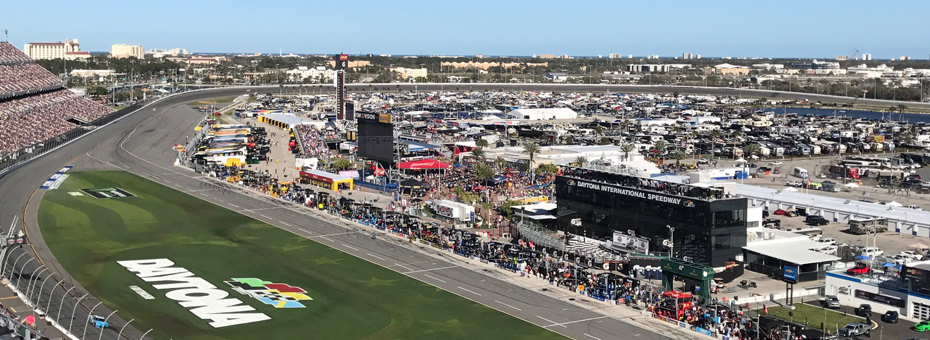
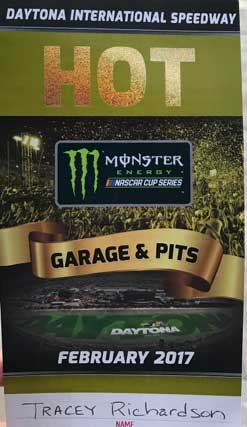
 This past weekend Ernie and I had the unique opportunity to attain highly-sought pit passes for the Daytona 500. We had a hint that our experience would be a lesson in visual management, from the way the pass itself shared information.
We enjoy all NASCAR races. Having this rare access to the pit areas was not just a privilege for us, but an opportunity to see, up close, the power of visual management among the incredible teams that support the drivers. We observed examples of lean thinking that provided some team a 1/2 and 1/4 second advantages—enough to mean the difference between a first place finish or coming in between fifth or even tenth. We appreciate the big power of finding these small savings: coming from Toyota we were also conditioned to look for miniscule amounts of waste, so it’s fascinating to me how kaizen is used during a race and how the pit teams look for easy ideas that add minimal cost to the overall.
One of our first discoveries was the way that some teams had developed clever markings on the wheels and hubs. Notice how one team has no visual controls, while the other has pink paint marks, highlighted with black on the outside, for improved visuality to show a perfect alignment to the lug-nut pattern where the wheel meets the hub. We talked to this Pit Team member who said they have found if they take the time to use a paint marker to visualize exactly where the tire changer goes it can save a half of second or so to avoid the rework of taking a split second to realign.
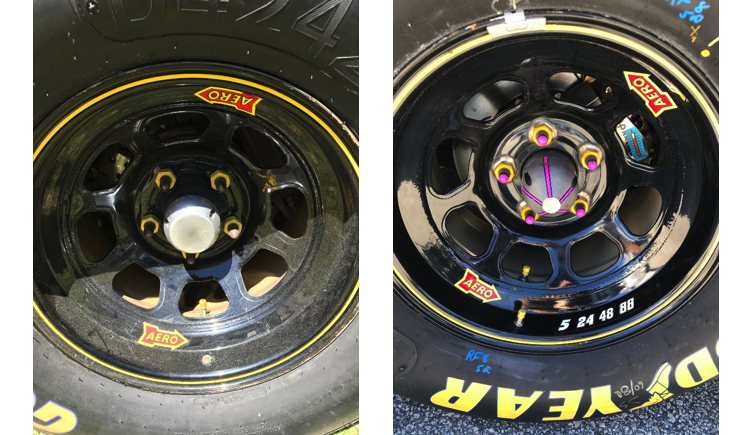
If you know anything about pit stops, what used to be a good pit stop a couple of years ago took around 14 seconds; through kaizen thinking and other technology that has dropped into the 12s for leading teams. We thought from a cost perspective (paint markers and a few minutes per wheel) that it was a great investment of time for what could be potentially big gains on pit row per pit stop, a half of second in the pits is huge for a team. With some races coming down to a difference of 1/100th of a second between first and second place, this could mean all the difference in the world.
Take another look at the wheels: if you look very closely in the pic with the visual marking you see a white substance between the lug-nut and the wheel. That is a special glue that holds all the lug-nuts on just tight enough for placement, saving lots of time, which was a kaizen from several years ago. I wasn’t able to get a picture, but one of the wheel changers also tapped 2 extra lug-nuts on the back of his glove to have very quick access if one popped off during installation. This happens from time to time and to have quick access to one can mean many positions if the wheel changer has to take time to get another.
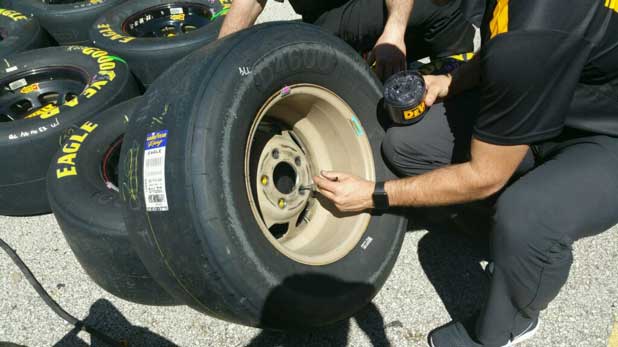
Another unique discovery we observed (we did our best to go see everything we could at the gemba pit stop) was this process of using a metal pick to apply a mild lubricant on the hole of each wheel. We asked the Pit team member why he was doing this and he said their data showed that the wheel went on smoother and quicker if the lubricant was there and would hit the threaded stud during installation. Again, another very small idea that could lead to 1/4th to 1/2 of a second—all of which adds up with 4 wheel changes. All this was pre-work setup on all the sets of tires in the pit area for changes through the race. Each of the teams seemed to have different strategies for time savings, some shared and perhaps some not, if it was a competitor.
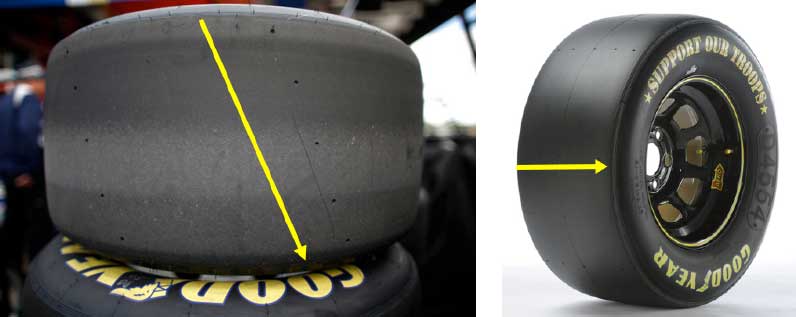
Ernie and I discuss leading and lagging key performance indicators a lot in our sessions. Lagging being reactive and leading being predictive. Now, notice the small wear indicators on the tires, one going straight across the tire and one going diagonal (see yellow arrows). This differentiates between right and left tires (rights are 1” wider). Also, this gives wear depth in different areas of the tire to determine pressure, camber, and toe placement for the next pit. In addition, other contributing factors like track temp, outside temps, sun in or out, wind speeds and humidity levels. After each pit these are analyzed to make real time adjustments to improve how the car handles till the next pit stop. The simplest of things can tell a team a vast amount of knowledge and manage problems—and not have the problems managing the pit team.
Lastly, we noticed that the teams have instant video in their pits, so after the pit stop, there is a review of what the current state was in the pits and what their standard is to reach for each type pit. They can quickly recognize gaps at the process real-time versus making assumptions and reacting the next.
Nascar is a great example for us all in regard to very small kaizens that make a huge difference in human motion and visuality to the product. Also, using more leading indicators to predict the outcome at each pit stop intervals (4-10 pit stops depending upon the track size and cautions), so learning to find leading is part of their business model to compete.
