As a key component of Lean and lean management systems, visual management offers tools and practices that support adherence to standards, quick identification of abnormalities, daily problem solving, organizational alignment, and–when integrated with leader standardized work–the daily routine of lean leaders. But many companies employ insufficient visual tools and practices. Business journalist Doug Bartholomew spoke with LEI faculty member Mark Hamel on the benefits of a visual management system integrated with an effective management system.
Bartholomew: Why is a visual management system important to the lean effort?
Hamel: An organization can conduct a series of kaizen events and achieve substantial improvements. But sustainability and cultural development are a huge challenge. Without having a visual management perspective in place, it’s difficult for people to know what good is, what the standard is, and whether it is being maintained. People need to be able to tell if they have a problem. Visual controls are part of that.
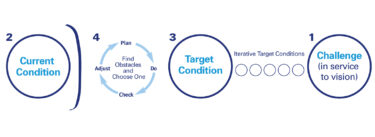
Lean at its most basic level can be defined — perhaps over-simplistically — as ‘find a problem, fix a problem, and keep it from coming back.’ Clearly, we first have to identify a problem, or at least the perception of a problem. We know the basic definition of a problem is the gap between the current condition and the standard or target condition.
Effective visual management makes gemba-based identification of the gap more real-time and unambiguous for the individual and the team. Visual management clearly points out the existence of unidentified or non-remedied problems.
Bartholomew: How do you design a visual management system? What kinds of business process information should be displayed?

Visual management dovetails with leader standard work.
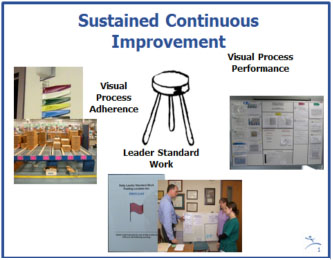
Hamel: The visual elements should be built around the value stream and its processes. Visuals can be placed into two broad categories based on purpose: visual process adherence (VPA) and visual process performance (VPP).
As the name implies, VPA is about adherence to process standards. However, when incorporated with gemba-based leader standardized work, it also has to do with the sufficiency of the process. VPA tools include things like operator standardized work, material replenishment systems, and their cards, totes, boards, etc., and production analysis boards. These tools help the workers and lean leaders quickly identify abnormalities, ask why they are occurring, and make the necessary adjustments.
An example of a VPA scenario could be a primary care patient visit value stream that includes a FIFO lane preceding the check-in desk. We need to understand if that system feature is working as designed. At a glance, we should be able to determine if patients are flowing in a first-in-first-out manner and if the queue is below, at, or above the designated maximum level.
In this non-industrial setting, you might want to use stanchions and/or potted plants to delineate the lane and flow and help workers see if the FIFO lane max has been exceeded. If the maximum level is exceeded, standardized work may require the triggering of a visual signal for an additional check-in resource to flex and arrive within a specified time.
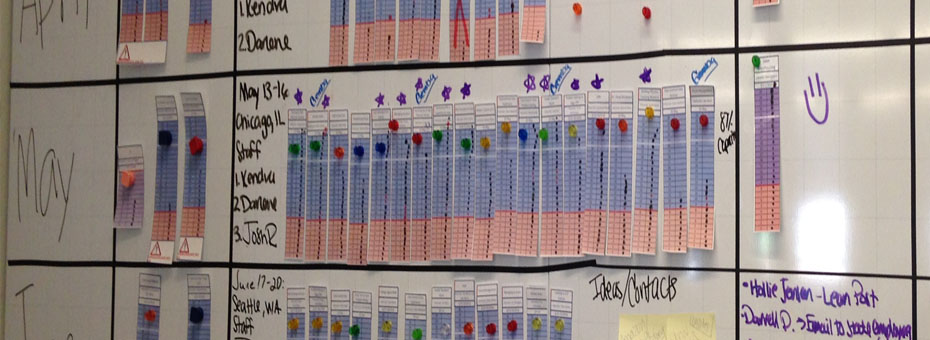
VPP typically represents metrics related to categories of people, quality, delivery, cost, and continuous improvement. These tend to be simple, actionable, and specific sets of timely metrics that provide insight to teams relative to how they are trending and performing versus an unambiguous target. When used in the context of frequent, standard team-based meetings or huddles, these metrics can be a powerful tool that drives vertical and horizontal alignment throughout the organization.
Bartholomew: How do the various visual tools work together?
Hamel: The various elements are integrated across the five tools of the lean management system: gemba walks, reflection or huddle meetings, andons and andon response, accountability process, and mentoring. For example, one or more visual performance metrics may tell the story of yield issues. At the same time, the leader may have observed during recent gemba walks a lack of adherence to standardized work across multiple operators within the defect generating process. This is part of the broader story that should be respectfully explored during a team reflection meeting.
Bartholomew: How do some visual tools fall short?
Hamel: You might have visuals that look cool, but that are not actionable. For instance, I was at a company that was processing benefits, and they had a big board that tracked their daily backlog, processing totals, etc. But none of the visual information could tell you whether the current situation was good or bad.
The entire work team and leadership need to know if they are having a good day or a bad day. When I asked the workers about the big board they had, they told me they really didn’t use it. In other words, it was not driving the desired behaviors. So the first thing we need to ask is: what’s the question we are trying to answer with this visual tool?
In another facility I visited, we conducted a plus/delta review on the team’s daily huddle. While there were plenty of ‘pluses,’ there were more than a few deltas. One of the deltas indicated that more than a few team members didn’t understand the meaning of some of the visual process performance metrics on their board. Clearly, it’s difficult to engage and align the team if they can’t all see and understand together as a team. In this particular situation, a couple of the metrics were poorly designed — visually way too complex.
In the final analysis, if you look at a visual and can’t quickly arrive at an adequate answer to the ‘So what?’ question, you’re in trouble.
Bartholomew: What are some common mistakes organizations make with visual management?
Hamel: To be effective, visuals should start from need — in other words, what is the problem you are trying to solve? What is the normal condition that we are trying to maintain? Then we want to answer the question as simplistically as possible.
Another problem is that visuals often are not maintained. The end result is that over time, the workplace becomes strewn with unused or half-used visuals. This is essentially visual pollution– muda.
Many lean leaders visit other companies to supplement their learning. Unfortunately, these leaders often fall into the ‘industrial tourism’ trap — they take what they ‘see’ and superficially replicate many of the visual tools back at their operation. In other words, their understanding of visual management tends to be merely tool-based (know what, but not why), missing its powerful lean management context.
 |
|
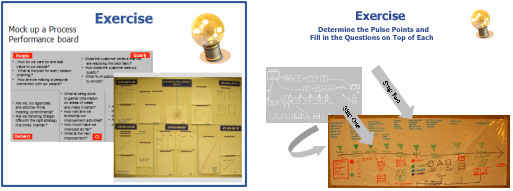
Hands-on exercises give you experience developing visual tools and metrics. |


