Dear Gemba Coach,
We work with an industrial process that is mostly low volume/ high mix, with both machining of components and assembly. We respond to customer orders, but our OTD is somewhere between 70% and 80%. Weíve invested heavily in value-stream mapping and kanban, but canít seem to improve our delivery. Any advice?
I feel for you as I know first-hand such problems can be quite intractable and frustrating so don’t give up! The difficulty in high-mix processes is usually not so much the flow, but spotting where pull (stock replenishment) and push (make to order) interact. In such cases, a combination of kanban and value-stream mapping should help, but there are a number of pitfalls to steer clear off.
The most obvious trap is that trying to map the value streams of all components that go into the final product is like digging a hole in the sand: the more you dig, the more you find. This is the most common mistake I’ve come across. Rather than worry about the information flow in the value-stream map (VSM), lean teams are often obsessed with the physical flow and start drawing every process. To their dismay, they find the complexity of the full flow increasingly daunting. And the more they map, the less they see any obvious way to improve the flow, so figure they’d better leave it all to the MRP to sort out.
VSM can be very useful to look at the overall process and distinguish assembly, which is usually a straight first-in, first-out (FIFO) flow (like a conveyor in an automotive plant). All components reach the assembly start, and then value is added until finished products come off the line and go to packing. The challenge at this stage is to find consistent product family and decide whether to flow everything through one product line (lower takt time, greater productivity, but much higher complexity and difficulty to teach standard world) or to create several distinct lines (higher takt time, less productivity, but lesser need for multi-competence). In general, plants tend to start with lots of small dedicated cells, and as they master the process, create lines capable of dealing with broader ranges of products, in order to improve productivity — which requires a degree of maturity in standard work training in order to guarantee quality.
But at some point in the plant, the components are machined, and this is usually hard to establish as a straightforward pull systems as some components will be runners, and some will be strangers. This is where kanban-thinking needs to be taken into account in drawing value streams.
Runners and Strangers
Ideally, all machining cells should own their own production in dedicated “shop stocks” at the foot of the machine. An internal “small train” (a tugger with wagons of shelves on wheels) can then pick up from the machining cell and bring the components straight to assembly just in time. The shop stock is made of several lanes for high runner parts and a lane for made to order (which is picked up every time the train passes). Runners are pretty straightforward to have in replenishment kanban (pick one, make one), but strangers need to be scheduled the old-fashioned way through production instructions that go straight to the kanban cards queue.
In many cases, though, plants find it hard to hold all parts at the machine, and will chose to build a central market that acts as a buffer between machining and assembly. Think of it as a kitting area, where all the components are put together as a kit, so that assembly has to, well, assemble what is brought to the line. In practice, most factories end up with a mixed system of kitted main parts and kanban-driven stock replenishment runner components. The frontier between one or the other keeps shifting according to demand mix and maturity of the plant. There is no right answer there, only kaizen.
At this stage, VSM is an essential tool to sketch out different possibilities of shop stock vs market and how to deal with getting the right information at the right time and the right place. An easy error to make is to focus on the physical flow (and production performance) aspect of the value-stream map and sketch out roughly the information flows as dotted line from “logistics” to the cell. In fact, sorting out information flows is where the VSM is probably the most useful. To do so, lean thinkers must go in much greater detail than they often do:
- How does information arrive from the customer?
- How is it treated at logistics: splitting by stream, leveling by fractioning and mixing, what information goes to which process?
- How often is the information transmitted to the process — once a week, once a day, once an hour, real-time?
- Where do logistics customer instructions turn into production instructions (in many places, the reference numbers are different)?
- How does the train (or forklift) driver know what to pick up where and at what time?
- What is the picking frequency? How regular is the train?
- How many containers are handled at each transport?
Calculating Stock
Where kanban is used is particularly important because kanban cards are picked up and moved by the logistics train. The regularity and frequency of the trains is critical to the flow of information, for instance, and this really needs to be mapped in great detail to figure it out how to improve.
The key thing to keep in mind is that the more sluggish the information flow, the more parts are needed in inventory, and vice versa. If the train only comes every couple of hours, the cell can’t change its mind about what it builds within two hours. If the train comes with new kanban cards every half-hour, the demand can be adjusted every half-hour. Now, on the other hand if demand can be adjusted every half-hour, but slow tool changes at machining impose several hours long batches, no matter what happens on the demand the cell will continue to produce parts, whether they’re needed or not. The problem, of course, is that production of A is non-production of B, C, etc., so making too many of A means having a dearth of B (or keeping them in stock).
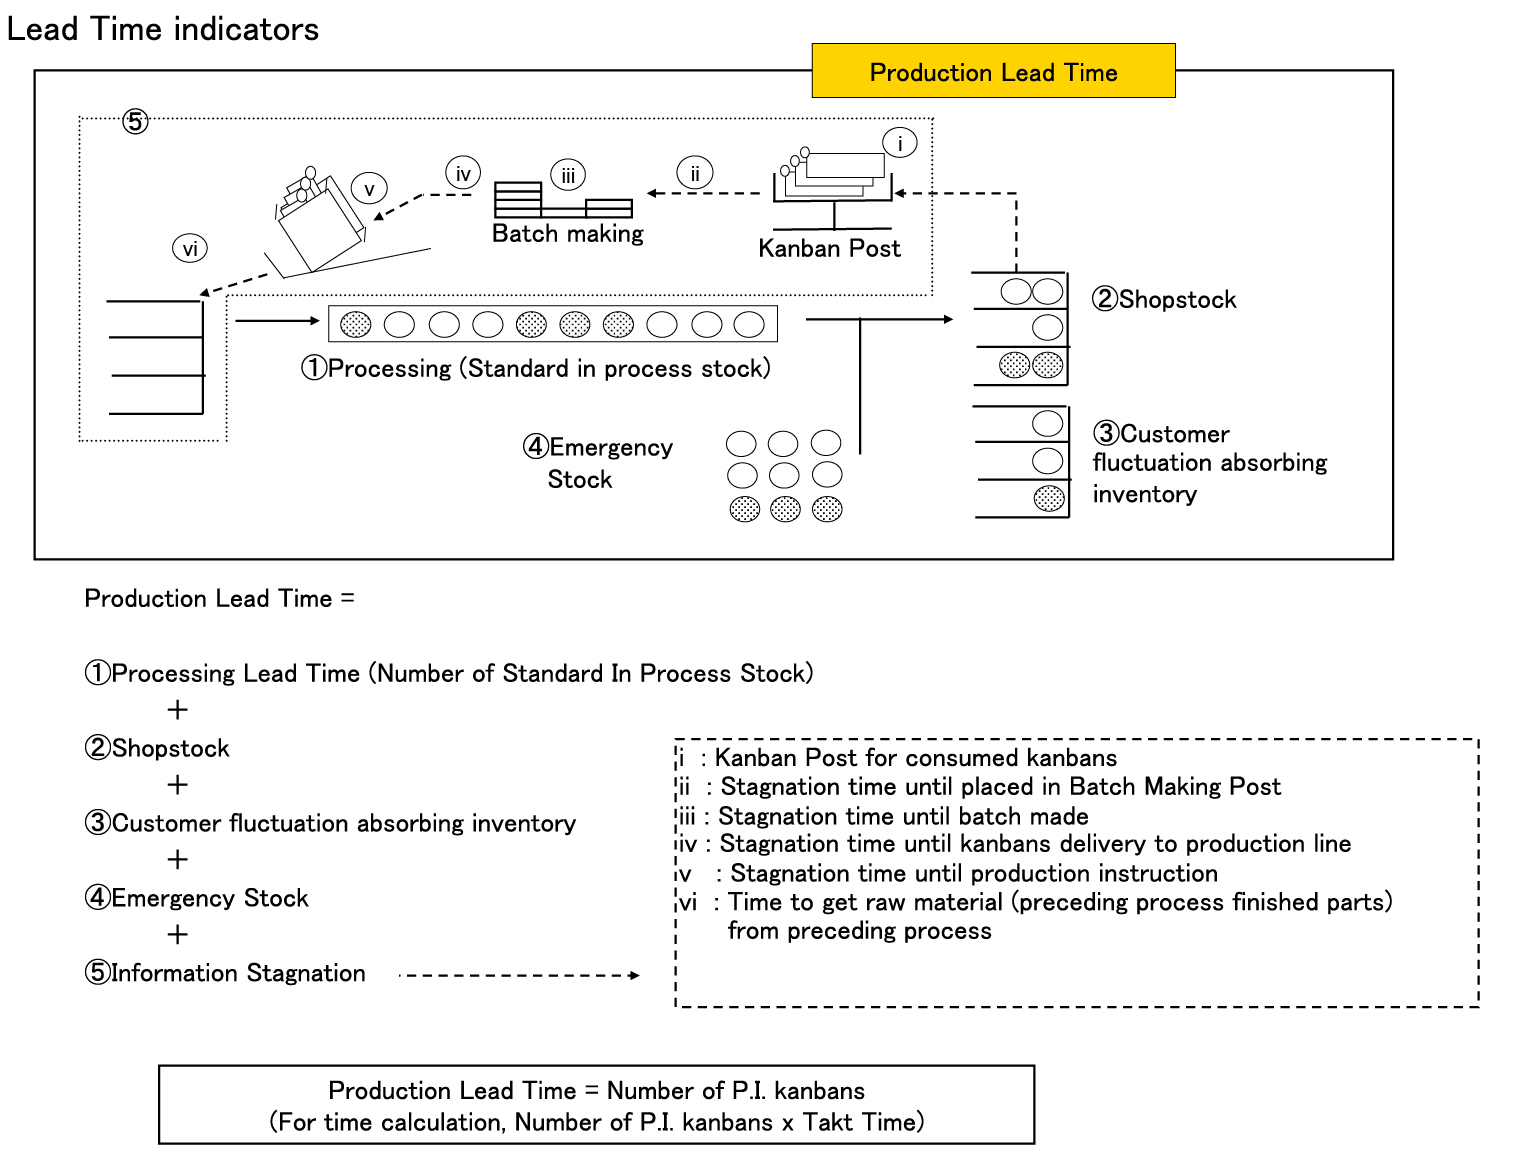
At the market, typically, the amount of stock is dictated by:
- A cycle stock of average daily demand x lead-time to replenish
- A buffer stock to cover demand variation as a % of cycle stock
- A safety factor as a % of cycle stock + buffer stock.
†
†Figure: Lead Time Indicators
There are many smart ways to calculate these various stocks, but I find that, in practice, operators learn quickly to guesstimate what should be kept in stock — the major blocking factor remains tool change time in every machining plant I’ve come across.
The second thing to keep in mind is that true strangers need to be run in an MRP-like system with safety stocks set at 0. If they are real strangers, they do come one at a time, and the plant has to learn to produce the stranger components one at a time as well. Another option, of course would be to hold one item of all the stranger parts in stock and to replenish it as soon as it’s consumed. This is a pretty smart way to go about it, but represents an inventory investment few plants are ready to do, particularly if you’re part of a larger group. Corporate simply wonít have it.
My point is not to go to lecture about the correct use of kanban to pull, but to point out that the most likely reason you’re floundering with Value Stream Mapping is due to too much focus on the material flow (and its performance — you know those boxes full of numbers) and not enough detail in the information flow. This, however, is where the real strength of the tool lies. Back in the day, with injection presses, I remember detailing the information flow in agonizing detail: hours of fun!
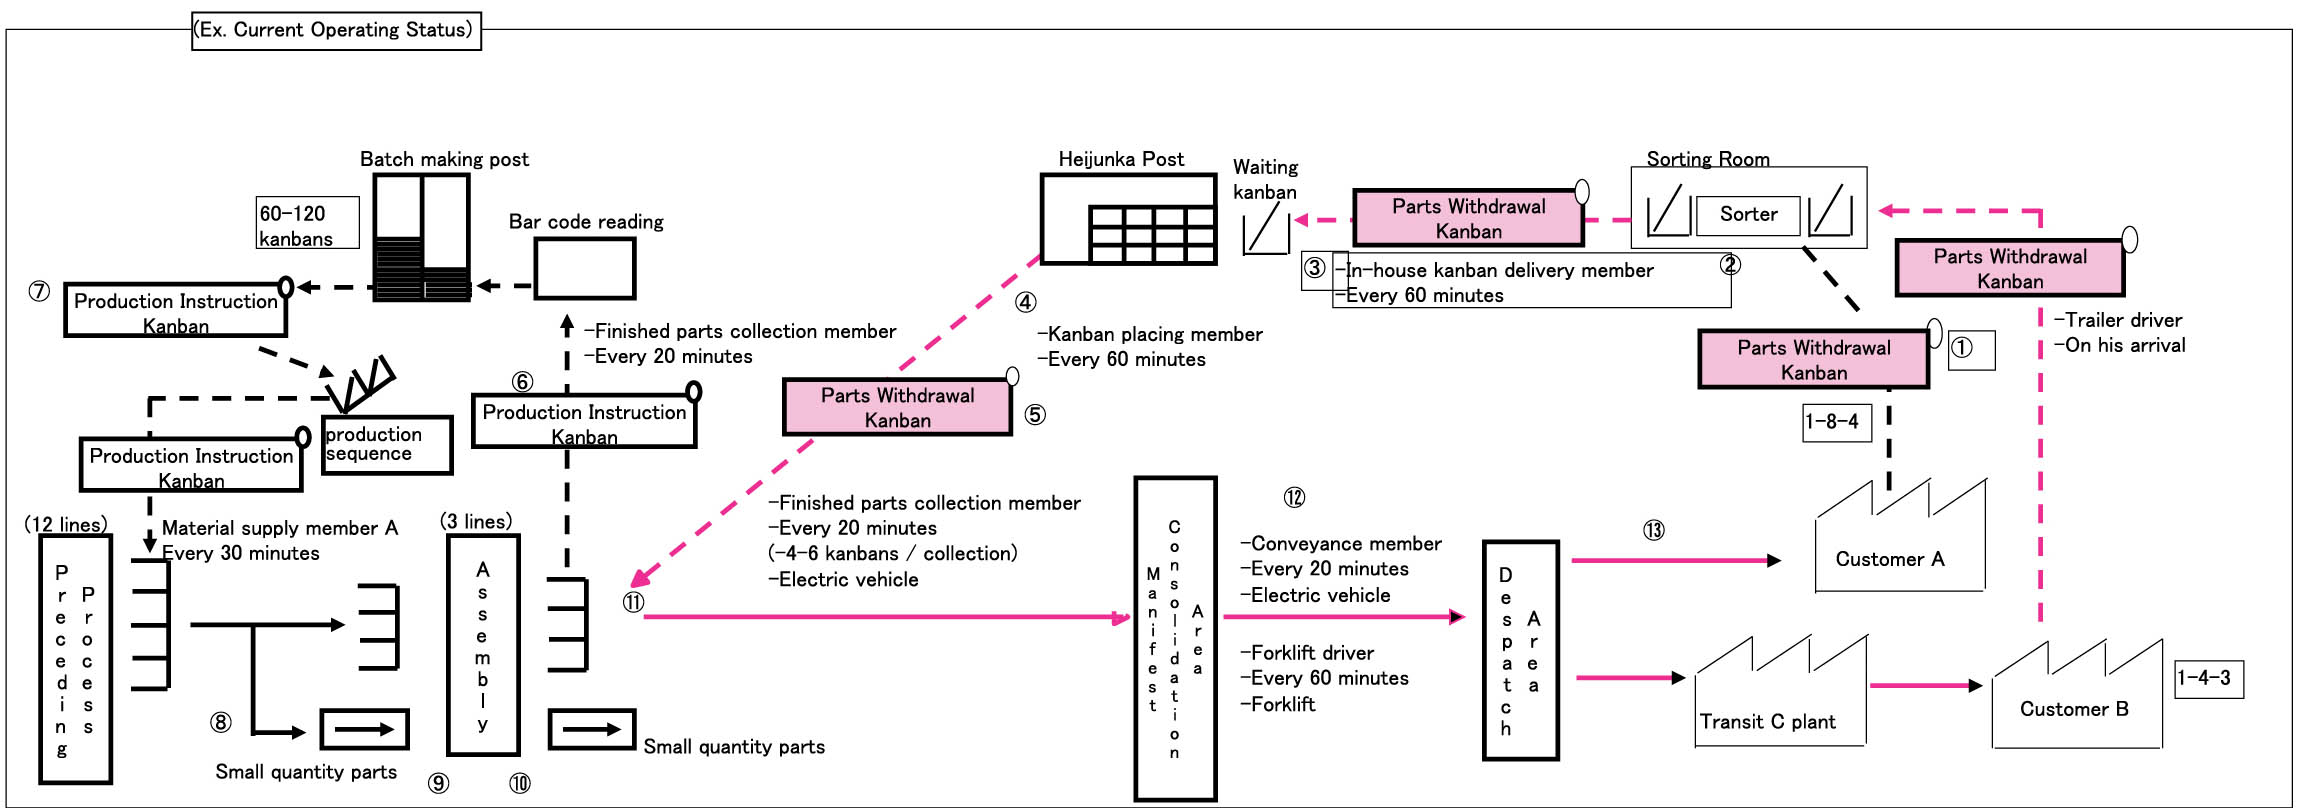
 Figure: Current Operating Status (click on image for detailed view)
At the risk of being monotonous, my advice would be the same as ever: identify the skill you need to learn to make the tool work, and, well, work at it until it does. Tools like value-stream mapping have been time-tested in many varied settings, so if it’s not delivering the right results, don’t fight the tool — the problem lies with how you use it. In my experience, the main difficulty with the VSM tool is to become expert at capturing the information flow (which is often complex, perverse and hidden in various IT systems). Here’s a fun test: if you can’t read what 1-4-3 means in the above graph, you’re probably going to have to hone your information analysis skills some more!


Hello,
what does 1-4-3 means? What does this refers to in the diagram?
Thank you